Elasticsearch Notes
Been recently playing with a lot of open source tool sets to figure out core solutions for different product ideas that I have. One of the recent technologies I have used is the Elasticsearch tool. Elasticsearch is basically a NoSql based indexing solution that allows one to use Lucene indexes on top of massive data sets especially string based documents. This blog post is just a bunch of notes that I have compiled. What is Elasticsearch?
Elasticsearch is a document store with each document stored as an index in a cluster with multiple shards. Sharding is basically a concept of partitioning data based on some metric within the data:
 Now Elasticsearch exposes an http based request-response to query the individual documents stored in the index.
In my case I created a 2 node cluster as shown in the following image:

After this step I created an index called imdb_search. Initially wanted to create a Graphing tool to showcase the connections that I had in facebook and the relations between them...but then I decided nah....will go with a more open public api search for JSON feeds. Note: I used the SENSE api provided by Marvel for the GET/POST/TRACE http commands to store/parse/write the data.
A note here is that the nodes can be reconfigured with a API call:
PUT /_cluster/settings { "persistent" : { "discovery.zen.minimum_master_nodes" : 2 } }
In this case I created an index with the following mappings --> movie_id, movie_name, movie_box_office_value, movie_date_of_release with the data types as shown in the above table.
Next I pulled the required JSON feeds for the documents from the imdb open api's. A couple of the queries I used are as follows:
http://www.imdb.com/xml/find?
Elasticsearch is a document store with each document stored as an index in a cluster with multiple shards. Sharding is basically a concept of partitioning data based on some metric within the data:

In my case I created a 2 node cluster as shown in the following image:

After this step I created an index called imdb_search
| POST /imdb_test { "mapping":{ "post": { "_routing":{ "required":"true", "path":"movie_name" }, "properties":{ "movie_id":{ type:"int" }, "movie_name":{ type:"string" }, "movie_box_office_value":{ type: "integer" }, "movie_date_of_release":{ type: "date" } } } } } |
A note here is that the nodes can be reconfigured with a API call:
PUT /_cluster/settings { "persistent" : { "discovery.zen.minimum_master_nodes" : 2 } }
In this case I created an index with the following mappings --> movie_id, movie_name, movie_box_office_value, movie_date_of_release with the data types as shown in the above table.
Next I pulled the required JSON feeds for the documents from the imdb open api's. A couple of the queries I used are as follows:
http://www.imdb.com/xml/find?
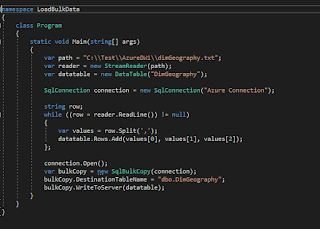
Using a mix and match of some of the data and generating random box office and date results in my temp C# parser, I dynamically created a few entries for my Elasticsearch document repository. A couple of the POSTS are as follows:
| POST imdb_test/post { "movie_name":"Star Wars: Episode VI - Return of the Jedi", "movie_id":1, "movie_box_office_value":7000000, "movie_date_of_release":"2005-07-01" } |
| POST imdb_test/post { "movie_name":"Terminator", "movie_id":2, "movie_box_office_value":10000000, "movie_date_of_release":"1994-06-04" } |
After generating a couple of data files for my index.... I was able to query the list with specific filters/ basic queries using _search like GET /imdb_test/_search or more complex queries like
GET imdb_test/post/_search
{
"query": {
"match": {
"user_name": "terminator"
}
}
,
"aggs": {
"all_words": {
"terms": {"field":"movie_name"}
}
}
}
I just stepped short after checking out my routing using the GET commands:
GET /imdb_test/post/Terminator
The next step was to create a SPA to generate a dashboard with the resultant set. The advantages of using Elasticsearch is primary its querying abilities on massive volume sets and can be useful in terms of document repositories like in my case, Blogging and even Geo based analysis of data. It works with JSON documents and also has a really cool analytics dashboard to show case the metrics of the environment called Kibana. We can also alias our index like in my example we can categorize the movies into Horror/Action/Comedy etc. genres by aliasing which is a pretty handy feature.
[9/16/2015]
On that note, I took the above ElasticSearch setttings and applied a Life Sciences need for the same. I stored my meta data results for the graphs inside Elastic Search and pulled in the required metric for the same. Now in my case I needed the graphs to be jazzy --> so I had 3 indexes sets with two seperate aliases each. And I changed the data feeds to the same. For the genetic algorithm, I basically leveraged the json feed from Karsten @ http://www.karstenahnert.com/. Also got a good idea for the dashboard from Colin @http://colinwhite.net/Dash2.5/ which was more for Hospital management.
Here is a sneek peek at the dashboard:-

Note: The red, green and blue were to mimic a heat map with trends that are hot - Red, luke warm - green and shallow - yellow. Used simple SVG rect for that portion.
The visualizations were done using D3 and the gets were fetched using Angular.....
On that note, I took the above ElasticSearch setttings and applied a Life Sciences need for the same. I stored my meta data results for the graphs inside Elastic Search and pulled in the required metric for the same. Now in my case I needed the graphs to be jazzy --> so I had 3 indexes sets with two seperate aliases each. And I changed the data feeds to the same. For the genetic algorithm, I basically leveraged the json feed from Karsten @ http://www.karstenahnert.com/. Also got a good idea for the dashboard from Colin @http://colinwhite.net/Dash2.5/ which was more for Hospital management.
Here is a sneek peek at the dashboard:-
Note: The red, green and blue were to mimic a heat map with trends that are hot - Red, luke warm - green and shallow - yellow. Used simple SVG rect for that portion.
The visualizations were done using D3 and the gets were fetched using Angular.....
Comments